

Chart studies, written out in full.
Longer reads built around one real chart each: what happened, why the clouds mattered and what to ask on your own charts.
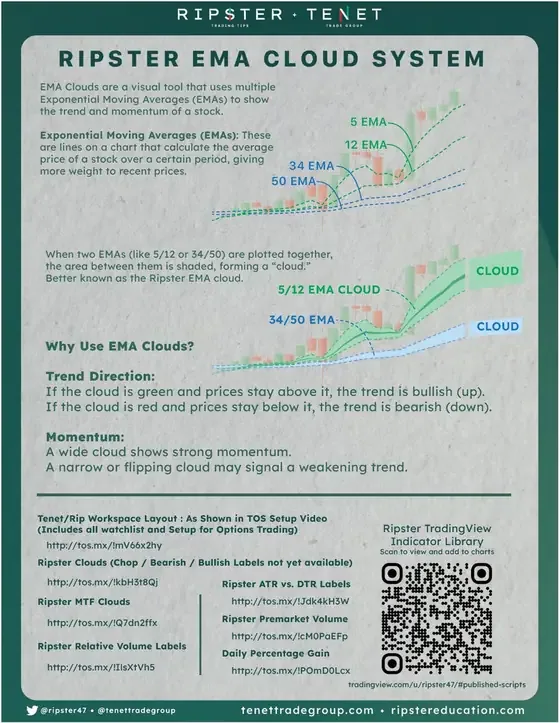
The 34-50 Cloud as Your Trend and Risk Line
Why the area between the 34 and 50 EMA, not a single line, decides bias on any timeframe, and how Rip uses it to define risk before entry.
Read the study →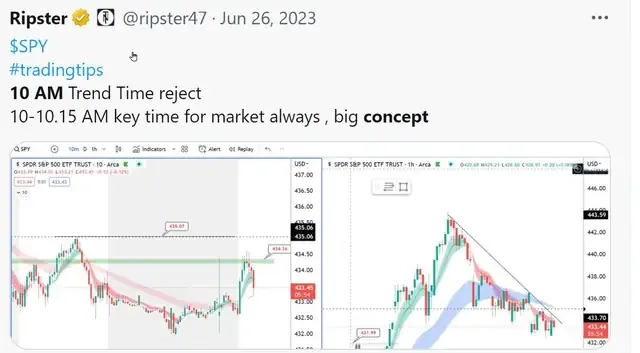
10 AM Trend Time on a Real SPY Chart
The 10:00 to 10:15 ET window in practice: a rejection on the 10-minute chart, and what it says about chop versus trend for the session.
Read the study →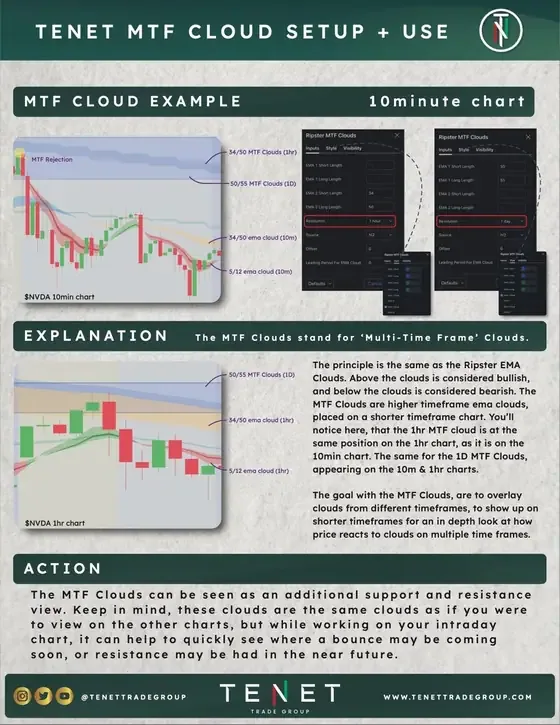
Higher-Timeframe Clouds on an Intraday Chart
How the daily 20/21 and 50/55 clouds act as support and resistance on a 10-minute chart, and the magnet between two MTF clouds.
Read the study →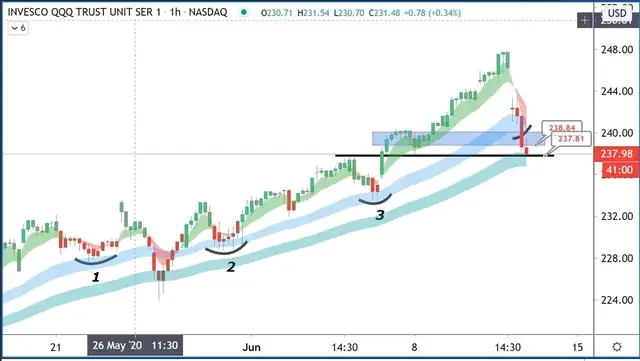
Three Pullbacks to the 1-Hour Cloud
A case study in holding a trend: each touch of the 1-hour cloud marked and explained, from the first pullback to the third.
Read the study →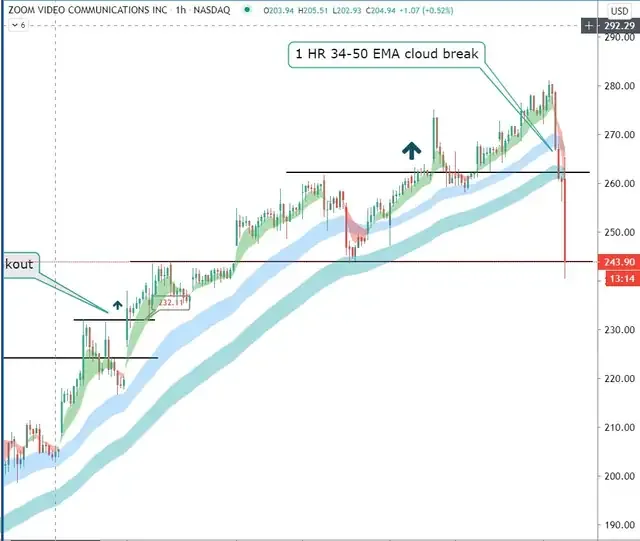
When the 1-Hour 34-50 Cloud Breaks
What a decisive break of the 1-hour 34-50 cloud says about swing positions, and how Rip manages risk around it.
Read the study →Find Your R: A Fixed-Risk Framework
Fixed risk per trade, 2R and 3R objectives, grading setups A+ to C, and the 50-trade comeback plan.
Read the study →Looking for sector and macro research?
Tenet Research publishes long-form, institutional-style research on sectors, themes and macro events. Rip is the founder.
Read Tenet Research articles →